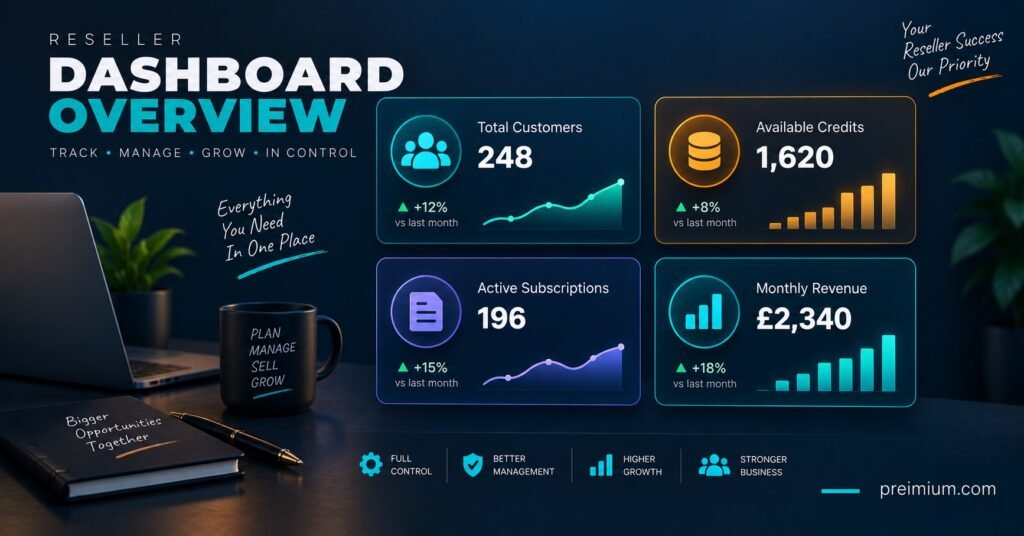
An IPTV Reseller KPI Dashboard pulls your active lines, renewal rate, refund activity and support load onto one screen, so you stop guessing how the business is actually performing week to week. Most IPTV Panel resellers start out checking a panel balance and a bank account and calling that “keeping an eye on things.” That works fine at ten customers. It falls apart at eighty, when renewals, refunds and support tickets start moving faster than any one person can hold in their head.
Why Spreadsheets Stop Working Once You Scale
A spreadsheet updated once a week tells you what happened last week. By the time you notice a renewal dip or a refund spike, the customers behind those numbers have often already left or complained publicly. A dashboard is not about looking more professional. It is about seeing a problem on the day it starts rather than the month it becomes obvious.
The shift usually happens around the same point for most resellers: somewhere between fifty and a hundred active customers, when manual tracking stops being quicker than the thing it is meant to replace.
The Four Clusters Worth Watching
Not every number deserves dashboard space. Trying to track everything usually means tracking nothing well. Four clusters cover almost everything that actually predicts whether the business is healthy or quietly failing.
Active Lines: The Core Health Number
Active lines are the customer accounts currently paying and running, not the total number you have ever created. A panel that shows “500 accounts” without separating active from expired, suspended or trial-only tells you very little. What matters is the trend in genuinely active, paying lines over time, and how that trend compares to new sign-ups.
If new activations are climbing but active lines are flat, customers are leaving roughly as fast as they arrive. That single comparison catches a leaking business months before the bank balance confirms it.
Renewals: Where Profit Actually Comes From
A first sale barely covers the cost of the trial and the time spent closing it. Profit comes from the second, third and twelfth month a customer stays. Renewal rate, tracked as a percentage of expiring accounts that actually renew on time, is arguably the single most important figure on the whole dashboard.
A Practical Guide to IPTV Reseller Renewal Strategy 2026 covers how to build reminder timing and win-back offers around this number specifically, which is worth reading alongside the dashboard itself, since the two are really one workflow split into two pieces.
Renewal rate connects directly to churn, so it is worth watching both side by side rather than treating them as separate topics. How to Calculate & Lower Your IPTV Reseller Panel Churn Rate walks through the maths if you have not settled on a consistent formula yet.
Pro tip: Track renewal rate by cohort, not just as one blended figure. A batch of customers who joined during a heavy discount push often renews worse than customers who paid full price, and blending the two hides that difference completely.
Refunds: The Signal Most Resellers Ignore
Refund requests get treated as one-off annoyances rather than data. That is a mistake. A rising refund rate almost always points to something specific: a buffering issue on a particular device, a misunderstanding at the point of sale, or a support response time that is pushing frustrated customers straight to a chargeback instead of a fix.
Track refunds as a percentage of new sign-ups each month, and note the stated reason against each one. Three refunds in a month tells you nothing. Three refunds citing the same device in the same fortnight tells you exactly where to look.
Support Load: The Early Warning System
Ticket volume, average response time and the proportion of tickets that reopen after being marked resolved together form the clearest early warning system available to a reseller. Support load usually rises before refunds do, and refunds usually rise before renewals fall. Watching support first buys you the most time to react.
IPTV Reseller Customer Support: What Actually Works goes into the operational side of keeping response times down, which is the practical partner to simply measuring them.
IPTV Reseller KPI Dashboard: What to Build First
Building all four clusters at once tends to stall the whole project. A more realistic order is active lines and renewals first, since those two numbers alone already reveal whether the business is growing or quietly shrinking. Refunds and support tracking can follow once the first two are running reliably and someone is actually checking them.
A basic version needs nothing more sophisticated than a shared spreadsheet updated on a fixed schedule, provided that schedule is actually kept. The tool matters far less than the discipline of updating it the same day every week.
| Metric cluster | What it measures | Sensible update frequency |
|---|---|---|
| Active lines | Paying accounts currently running | Weekly |
| Renewals | Percentage of expiring accounts renewed on time | Weekly |
| Refunds | Refund requests as a share of new sign-ups | Monthly |
| Support load | Ticket volume, response time, reopen rate | Weekly |
Common Mistakes That Make a Dashboard Useless
The most frequent mistake is building something detailed enough to impress nobody but the person who built it, then abandoning it after three weeks because updating it takes too long. A dashboard that takes fifteen minutes a week gets used. One that takes two hours does not.
The second common mistake is tracking totals instead of rates. Fifty new customers sounds good until you learn forty-five of the previous month’s customers left in the same period. Rates and comparisons tell the real story; raw counts on their own rarely do.
A third mistake is checking the dashboard only when something already feels wrong. By definition, that is too late for the early warning signs to help. A fixed weekly check, even a short one, catches far more than an anxious glance during a bad week.
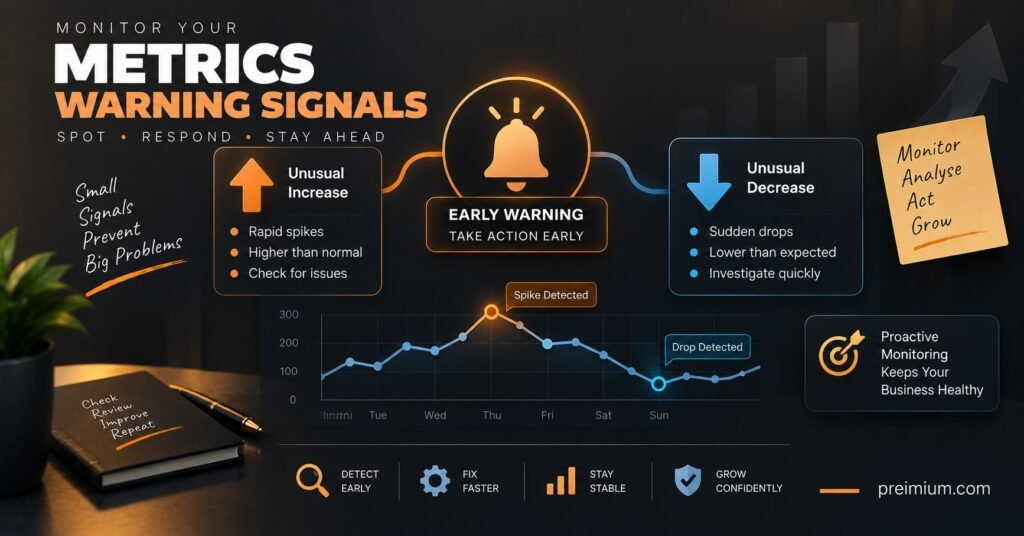
Pro tip: Colour-code renewal rate against a fixed target rather than comparing it only to last month. A slow decline from 92% to 85% over six months barely shows up month to month, but it shows up immediately against a fixed 90% line.
Choosing Tools Without Overbuilding
A dedicated CRM or reporting layer becomes worth the setup time once manual tracking starts eating a meaningful chunk of the week, not before. IPTV Reseller Panel CRM UK: Track Renewals in 2026 covers the point at which that switch tends to make sense and what a CRM adds that a spreadsheet cannot.
IPTV Reseller Credit Forecasting: Predict & Scale is a useful companion once active lines and renewals are being tracked properly, since forecasting credit needs depends entirely on having accurate numbers for both.
Pro tip: Whatever tool is used, keep the four clusters on one screen rather than spread across separate reports. The value of a dashboard comes from seeing renewals and refunds together, not from having tidier individual spreadsheets.
Frequently Asked Questions
How many metrics should a reseller dashboard actually include?
Four to six core numbers, one from each cluster, is usually enough. Additional detail can sit underneath for when something needs investigating, but the main view should stay simple enough to check in a few minutes.
Do I need software to build one, or is a spreadsheet enough?
A spreadsheet is genuinely enough at smaller scale, provided it is updated on a fixed schedule. Dedicated software becomes worthwhile once manual updates start taking a significant chunk of time each week.
What is a healthy renewal rate to aim for?
There is no single figure that fits every reseller, since pricing, market and customer type all affect it. What matters more is tracking the trend consistently and noticing when it moves away from your own historical average.
Should refunds be tracked separately from churn?
Yes. Churn covers customers who simply do not renew, while refunds cover active dissatisfaction serious enough to ask for money back. They often share a cause but need to be watched as separate figures to spot which one is driving the other.
How often should the dashboard actually be reviewed?
Weekly for active lines, renewals and support figures, and monthly for refunds is a reasonable starting cadence. Reviewing daily rarely adds insight and tends to encourage reacting to noise rather than genuine trends.
Conclusion
An IPTV Reseller Panel KPI Dashboard is only useful if it gets checked on a fixed schedule and built around numbers that actually predict trouble, not numbers that simply look impressive. Active lines and renewals matter most and deserve attention first. Refunds and support load follow naturally once the habit of checking is established, and together the four clusters give a far earlier warning than a bank balance ever will. Start small, keep the update routine short enough to actually stick to, and expand the detail only once the basic habit is solid.
Reseller Dashboard Setup Checklist
- Separate active, expired and trial accounts before counting anything as a headline number
- Track renewal rate as a percentage, by cohort, not as a single blended figure
- Log the stated reason behind every refund request, not just the total count
- Watch support ticket volume and reopen rate alongside response time
- Set a fixed day each week to update and actually review the dashboard
- Compare renewal rate against a fixed target line rather than only last month’s figure
- Move from spreadsheet to CRM only once manual updates are consistently eating significant time